


Bitcoin Recoils to $95K, But Classic Chart Pattern Projects 18% Gains

Bitcoin’s (BTC) price traded 9.5% above its Jan. 1 open of $87,500, and traders were confident that BTC’s short-term “trend is up” as the price approached a key level of interest.
Key takeaways:
-
Bitcoin price consolidates around $95,000 as bulls face a major barrier ahead.
-
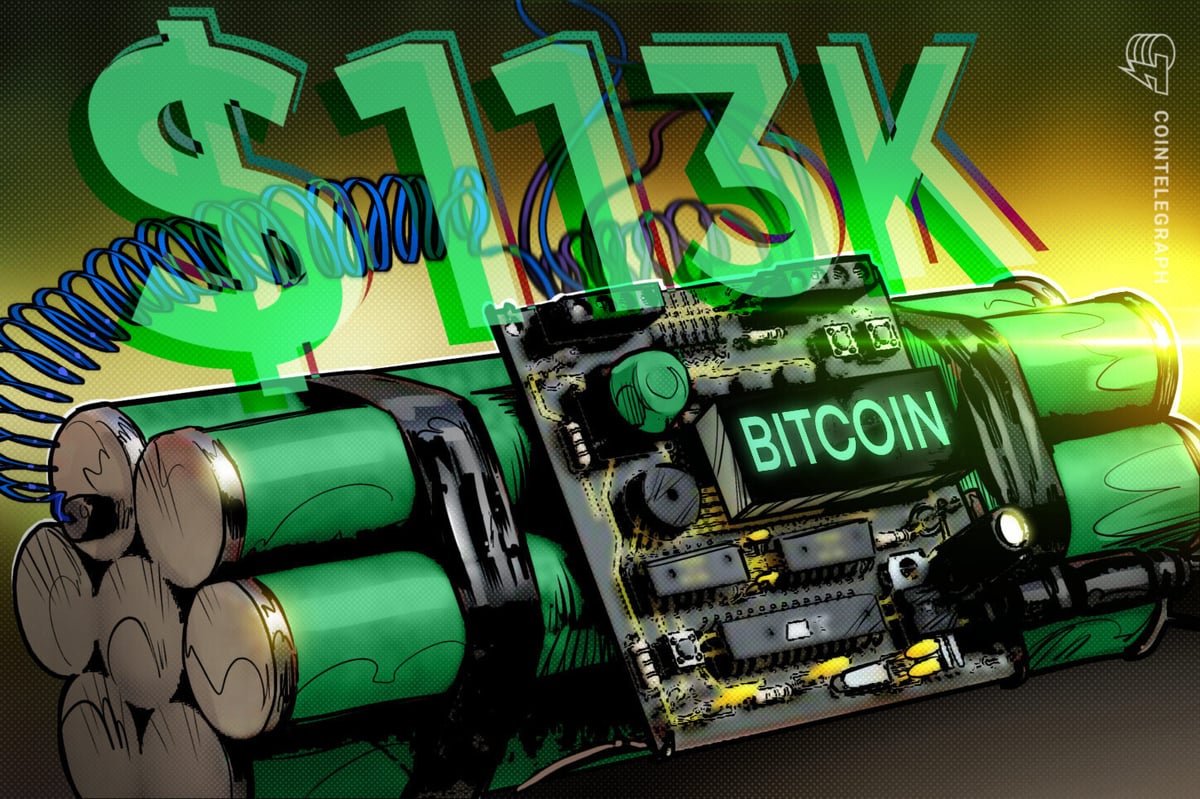
Technical analysis shows an ascending triangle targeting $113,200 BTC price.
Bitcoin price is at an “inflection point”
As Cointelegraph reported, Bitcoin’s ability to return to a six-figure price hinges on overcoming the resistance at $98,000 — the short-term holder (STH) cost basis.
This is the critical point on traders’ radar and one that has not received a convincing retest recently.
Related: Bitcoin rally collapses at $97K as funding rate stalls, retail traders sit out
“$BTC is approaching a key inflexion point,” said Glassnode analyst Chris Beamish in a Friday post on X, adding:
“Reclaiming the STH cost basis would signal that recent buyers are back in profit, typically a prerequisite for momentum to re-accelerate. ”
MN Capital Founder Michael van de Poppe said as long as the BTC/USD pair holds above the 21-day moving average at $91,200, “the trend is up,” and it will just be a matter of time until it breaks $100,000.
Analyst Mags spotted Bitcoin bouncing from a multi-year trendline in the weekly timeframe.
“Bitcoin is bouncing from the long-term trendline support it has been holding since March 2023,” Mags said in their latest analysis on X, adding:
“Each time the price has bounced from this support, we have witnessed a strong run-up.”

Note that the last time Bitcoin bounced off this trendline in October 2023, it rallied 172% to its previous all-time high of $73,800, reached on March 14, 2024.
Other analysts expect the BTC/USD pair to push higher into the six-figures, citing several factors, including whale accumulation, strong institutional demand, and positive onchain metrics.
Bitcoin’s ascending triangle targets $113,000
The BTC/USD pair is currently retesting the horizontal trendline of an ascending triangle, as shown on the daily chart below.
A major resistance zone sits between $96,000 (100-day EMA) and $99,500 (200-day EMA), which bulls must overcome to open the way for a run-up toward the measured target of the triangle at $113,200.

Bitcoin is consolidating in an “ascending triangle along with confirmed weekly hidden bullish divergence,” said analyst Matthew Hyland in a recent post on X, adding:
“Price goes up.”
The relative strength index has increased to 64 on Friday, from oversold conditions in mid-November.
This suggests Bitcoin is “trading strong but is pretty far from being overbought in the short term,” Daan Crypto Trades said, adding:
“There’s definitely a good amount of room to move higher for now. Just need the bulls to hold the lower timeframe bullish market structures.”
As Cointelegraph reported, a bullish divergence from the RSI and a MACD cross provided classic reversal signals as bulls eye $101,000 as the next major level to reclaim for a trend confirmation.

This article does not contain investment advice or recommendations. Every investment and trading move involves risk, and readers should conduct their own research when making a decision. While we strive to provide accurate and timely information, Cointelegraph does not guarantee the accuracy, completeness, or reliability of any information in this article. This article may contain forward-looking statements that are subject to risks and uncertainties. Cointelegraph will not be liable for any loss or damage arising from your reliance on this information.