


Can Notcoin (NOT) Price Break Above These Resistance Levels?


After an impressive rally within the first month of launch, Notcoin (NOT) now contends with market volatility and several factors that could jeopardize the cryptocurrency’s once-blooming future.
On several occasions, BeInCrypto explained how the token remained far below that elevated position. But is there light at the end of the tunnel?
Notcoin Struggles to Bounce Back
Notcoin emerged as the first major Telegram tap-to-earn project to launch its token back in May. The development, which saw the project distribute millions of tokens to its users, eventually led to a notable price decline within the first few days.
By June, Notcoin had rebounded from previous losses, reaching an all-time high of $0.028. Currently, the token is down 78% from that peak, trading at $0.0074. A glance at the 4-hour chart shows significant resistance at the $0.0085 and $0.0090 levels, which could pose challenges to upward momentum in the short term.
These levels, which show a high level of interest, remain crucial to Notcoin’s recovery. To have a chance at retaining these points, NOT has to retest the support at $0.0078 first, then attempt to rise above the resistance at $0.0082.
Read more: Top 7 Telegram Tap-to-Earn Games to Play in 2024
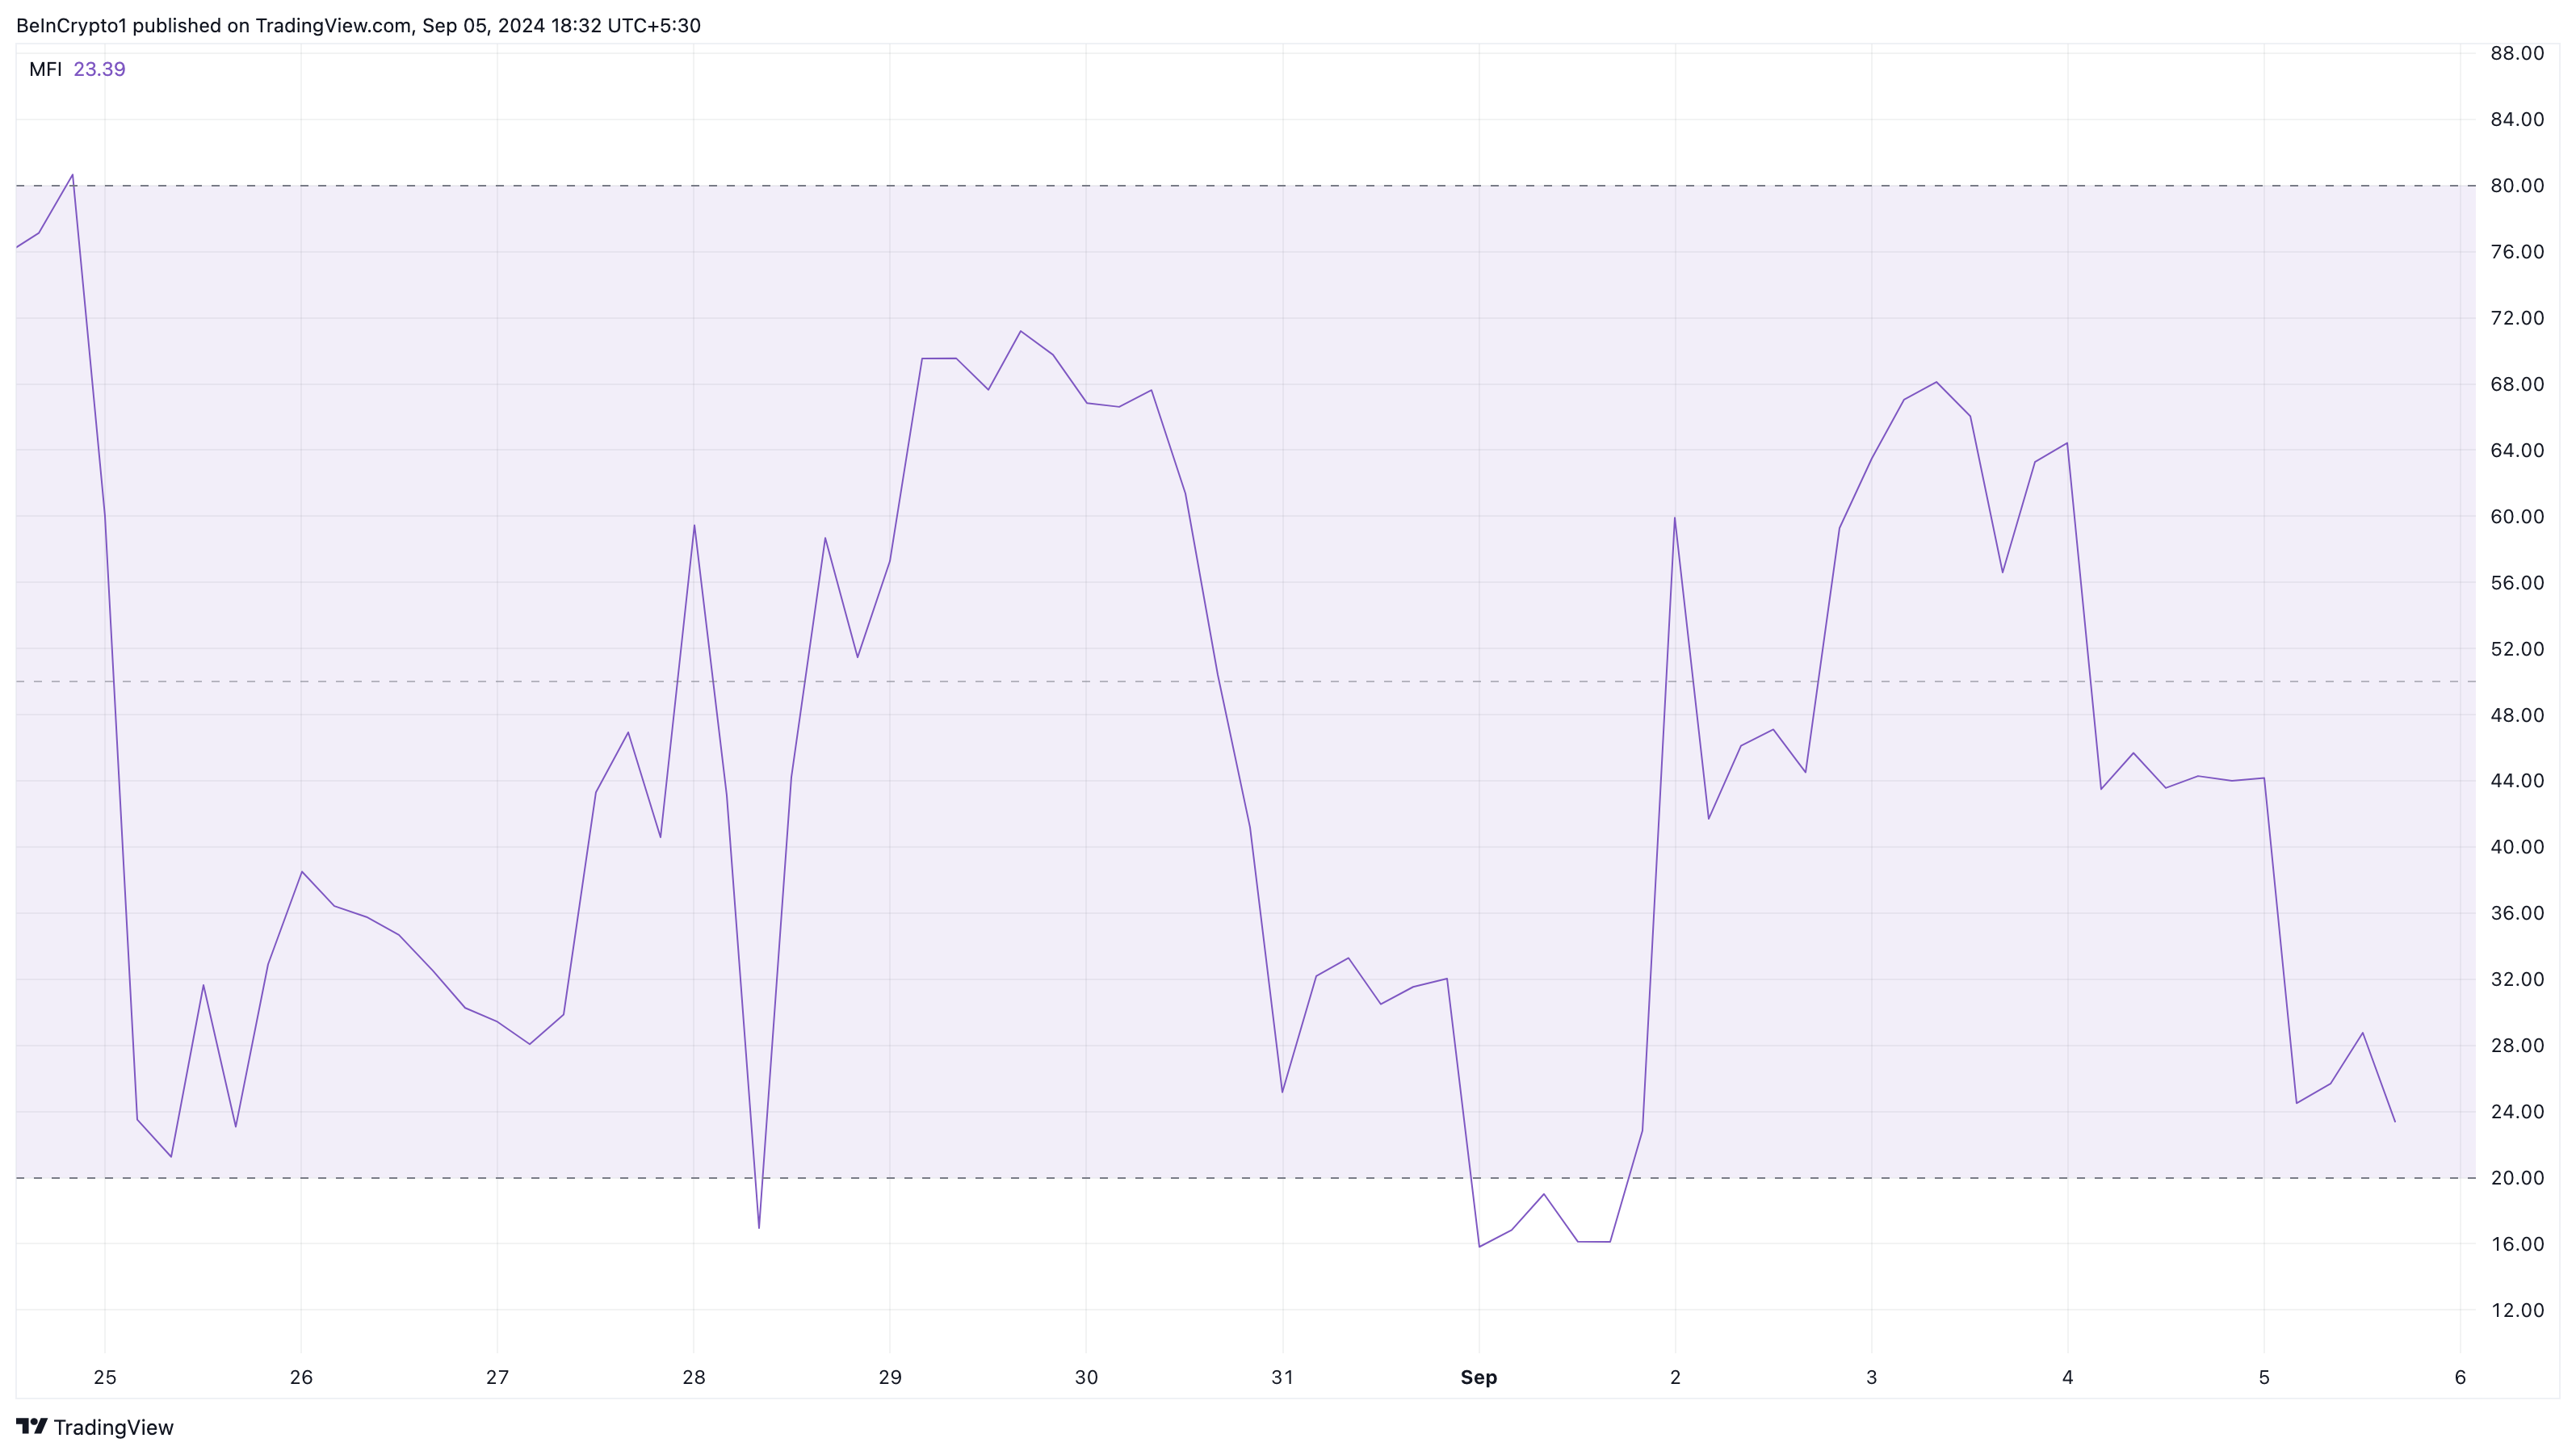
Yet, the Money Flow Index (MFI) reveals that the token continues to face headwinds in this recovery attempt. As a technical indicator that measures buying and selling pressure, the MFI can also spot when an asset is overbought or oversold.
When the reading rises above 80, it is overbought, and a price decrease could follow. A reading of 20 or below indicates an oversold condition, possibly preceding a price increase.
As of this writing, the MFI is down to 23.39, suggesting that Notcoin has little to no significant buying pressure. Therefore, a rebound might not happen in the short term.
NOT Price Prediction: No Breakthrough Yet
The daily chart also reveals a similar thesis to the analysis highlighted on the 4-hour timeframe. As seen in the image below, Notcoin attempted to surpass $0.012 on August 24. However, that effort was futile as bears forced the price down.
By August 26, the token had fallen below $0.010 and has since traded below this threshold. On looking at the Fibonacci retracement indicator, BeInCrypto noticed that the next support for NOT to hit could be around $0.0072.
However, market participants might need to monitor the MFI (Money Flow Index). If the MFI dips below 20.00, Notcoin would be considered oversold, potentially setting up for a rebound.
Read more: Where To Buy Notcoin: Top 5 Platforms In 2024
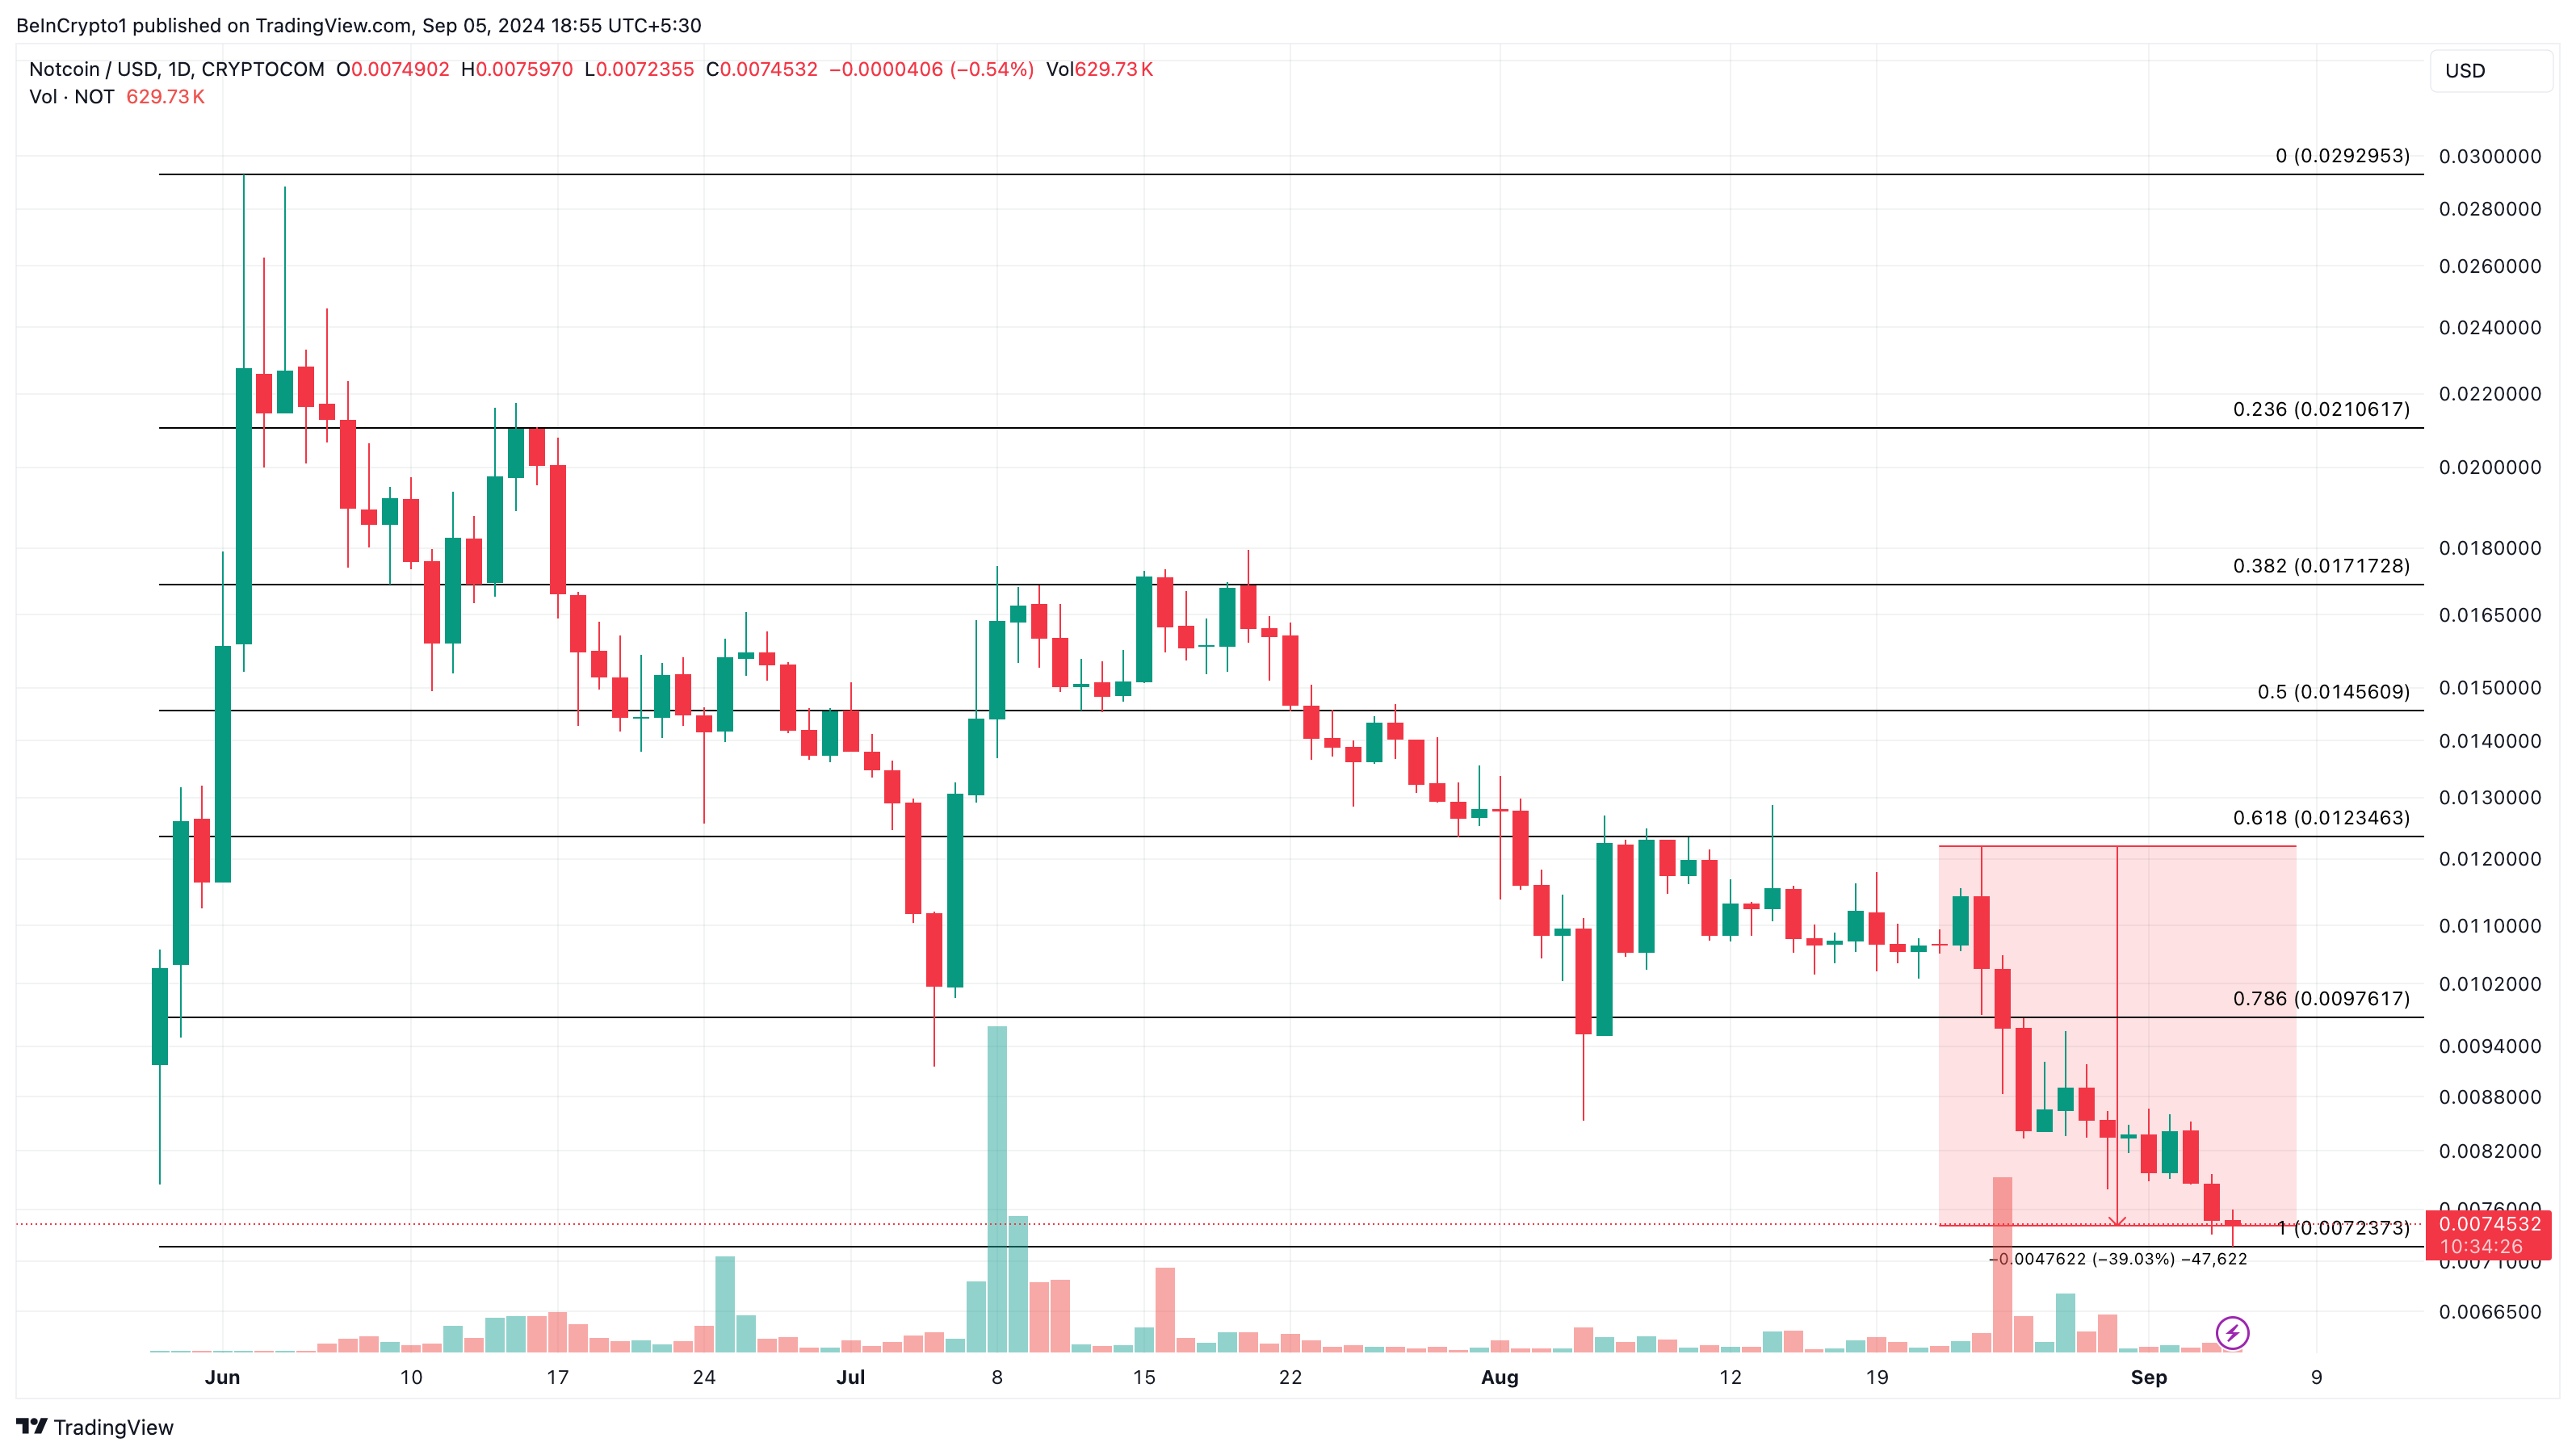
Should a rebound occur, the price could rise to $0.0097. However, regaining lost ground may be difficult, and any attempt to recover could face challenges, leading to an unsuccessful climb.
Disclaimer
In line with the Trust Project guidelines, this price analysis article is for informational purposes only and should not be considered financial or investment advice. BeInCrypto is committed to accurate, unbiased reporting, but market conditions are subject to change without notice. Always conduct your own research and consult with a professional before making any financial decisions. Please note that our Terms and Conditions, Privacy Policy, and Disclaimers have been updated.