


Pi Coin Price Jumps 11%—Why a Bigger Drop May Follow


Pi Coin price has rebounded nearly 11% since its February 23 low, climbing back to the $0.174 zone. This kind of recovery usually signals strength and attracts fresh buyers expecting a larger rally.
But this rebound may not be bullish at all. Instead, it may be forming the final phase of a bearish structure. At the same time, retail traders are aggressively buying the dip, even as deeper indicators show the recovery is weakening. This creates a situation where the rebound itself could increase the risk of a fresh drop, courtesy of a technical pattern.
Pi Coin Rebound Is Happening Inside a Bearish Pattern, Yet Retail Buys Anyway
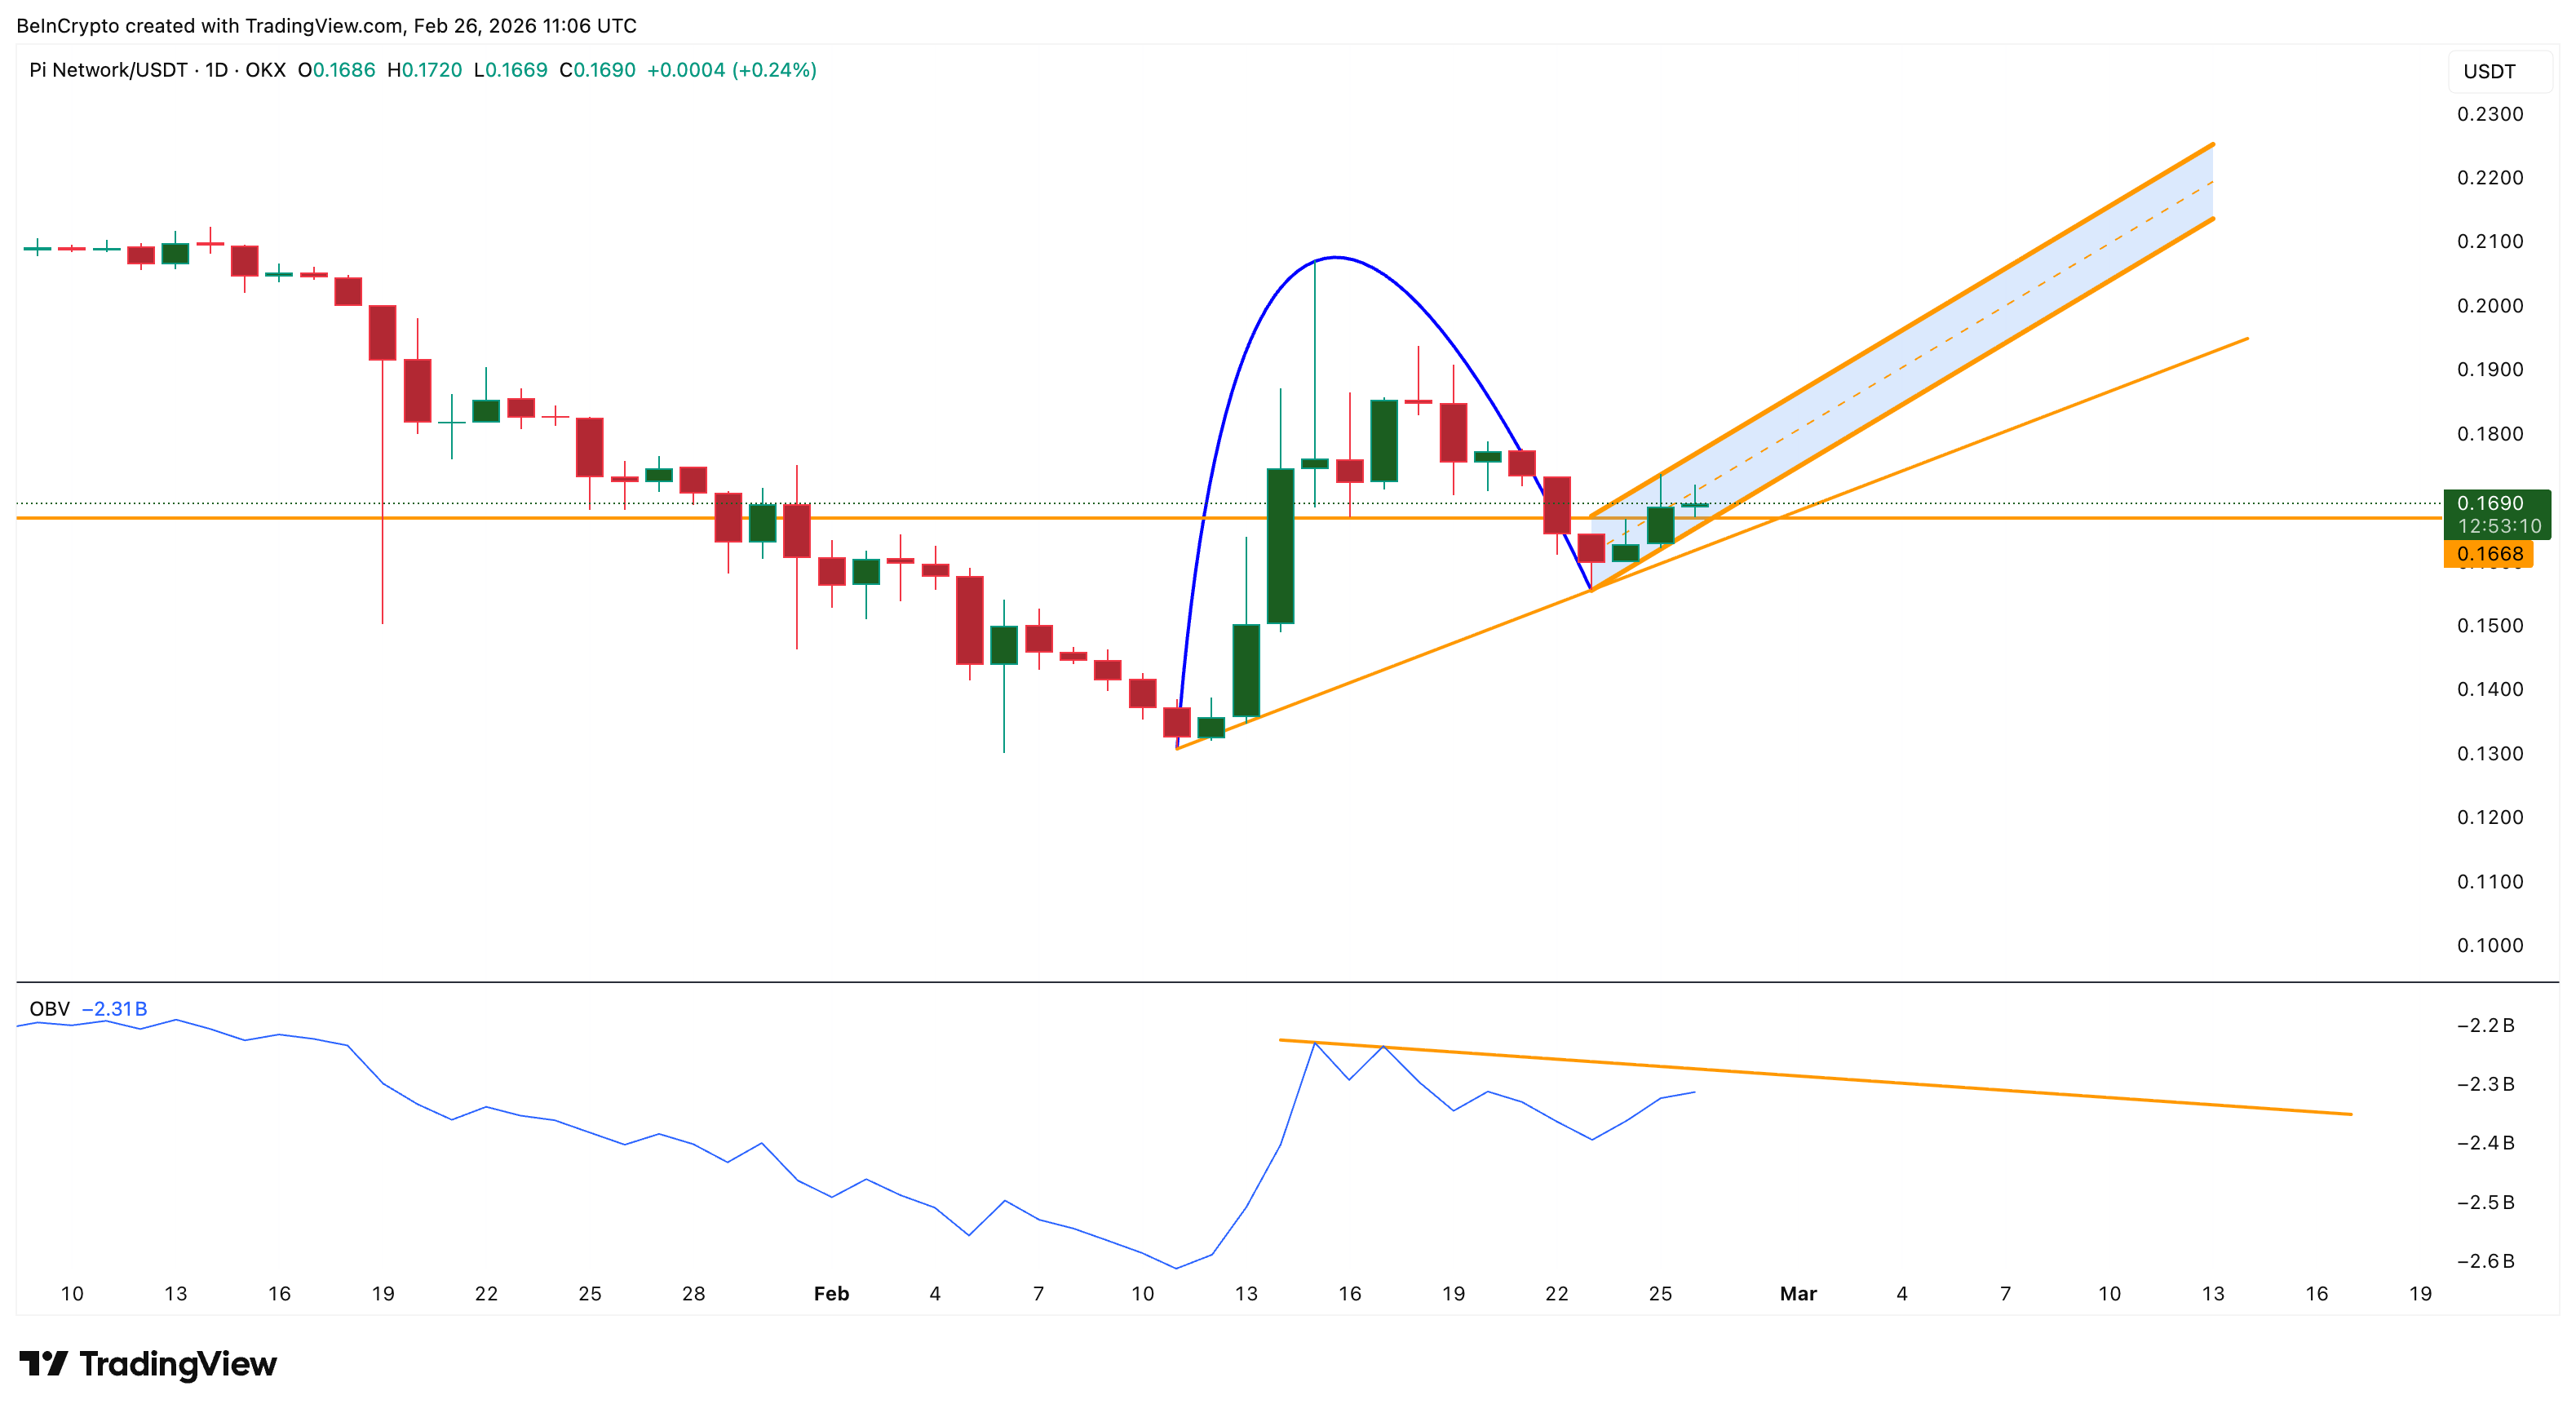
Pi Coin’s rebound is currently forming an inverted cup-and-handle pattern, a bearish structure that often leads to price declines. The current price rise represents the handle portion of this pattern. Handle rebounds often appear strong, but they typically fail below resistance and lead to breakdowns.
Want more token insights like this? Sign up for Editor Harsh Notariya’s Daily Crypto Newsletter here.
At the same time, money and volume indicators show a dangerous contradiction.
The On-Balance Volume (OBV), which tracks buying volume, has been rising steadily since February 23. This shows that traders are actively buying the dip and supporting the rebound. A push above the descending trendline could extend the dangerous rebound further, while keeping the entrants interested.
The Money Flow Index (MFI), which measures buying pressure using price and volume, confirms this behavior. Between February 16 and February 23, Pi Coin price continued falling and formed lower lows. But during the same period, MFI formed higher lows. This creates a bullish divergence in MFI.
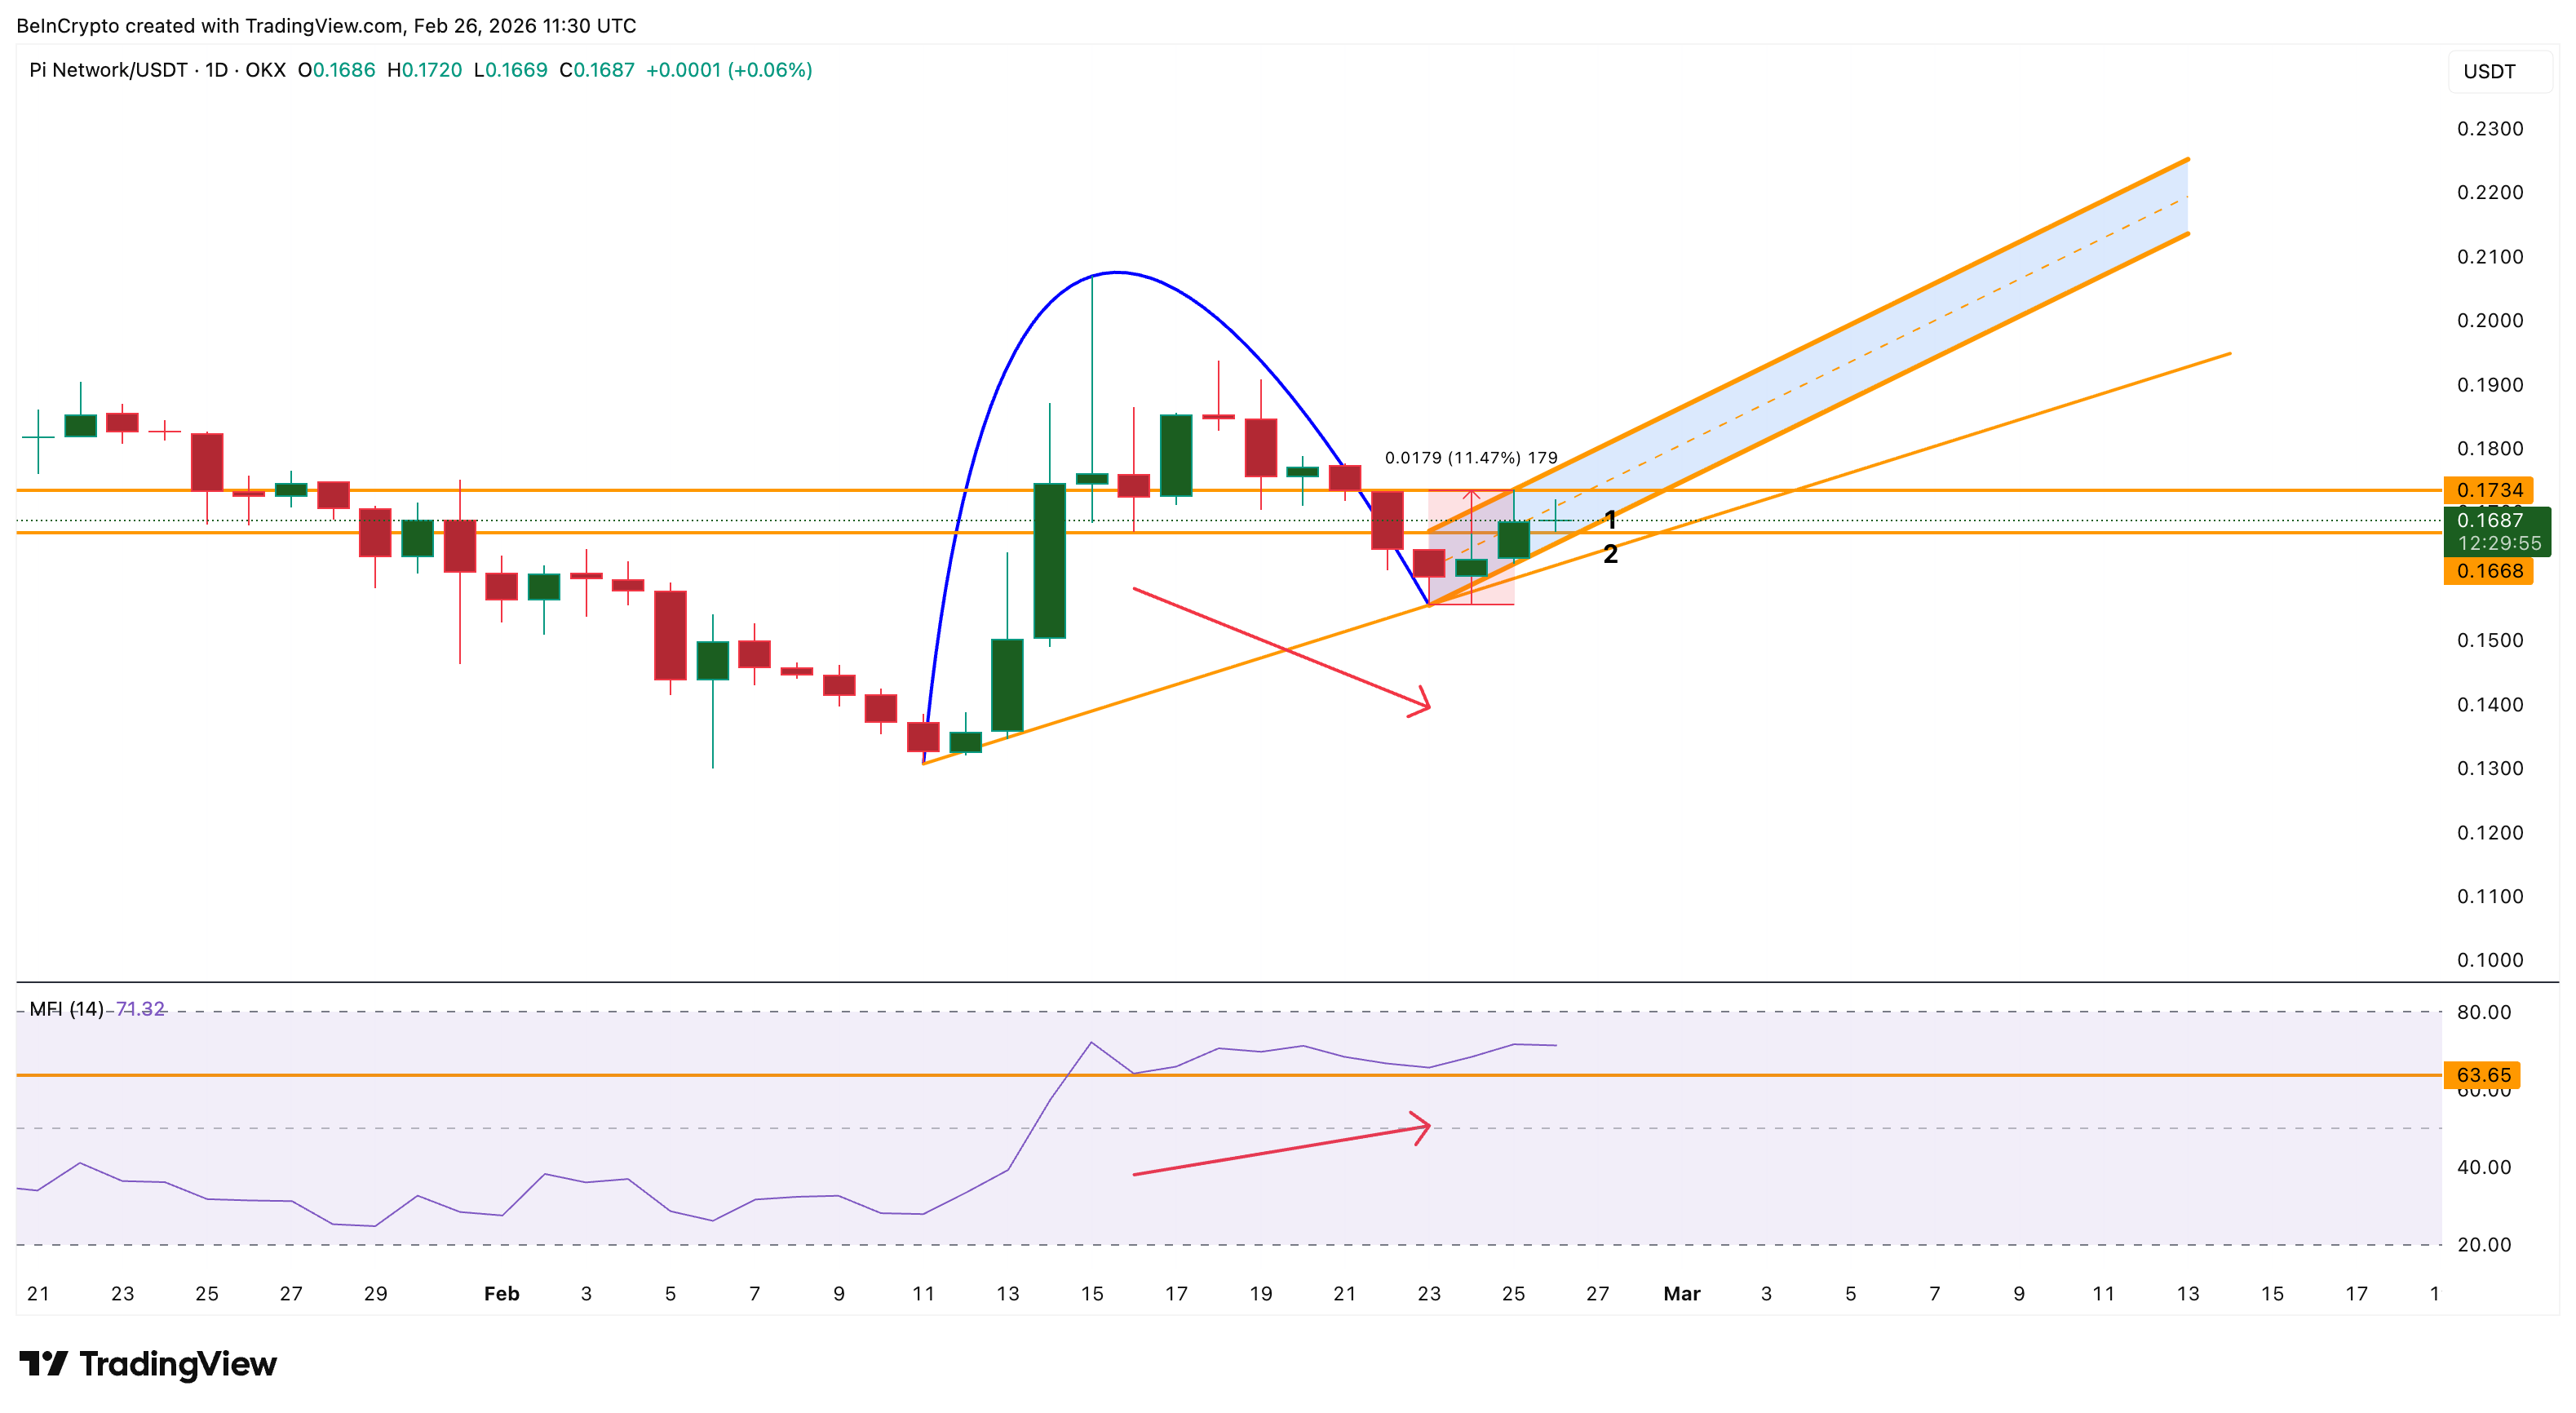
A bullish divergence happens when buying pressure increases even while the price falls. The OBV-MFI rise confirms aggressive dip-buying. But this is exactly what makes the situation dangerous. Retail buying is possibly increasing, but the PI price is still trapped inside a bearish structure. This creates the conditions for a potential trap.
Momentum Is Rising, But Price Strength Remains Weak
The weakness becomes clearer when looking at momentum strength compared to price structure. Between January 27 and February 25, the Pi Coin price formed a lower high. This means the rebound remained weaker than the previous rally and confirmed that the broader trend is still down.
At the same time, the Relative Strength Index (RSI), which measures momentum strength, formed a higher high. This creates a hidden bearish divergence.
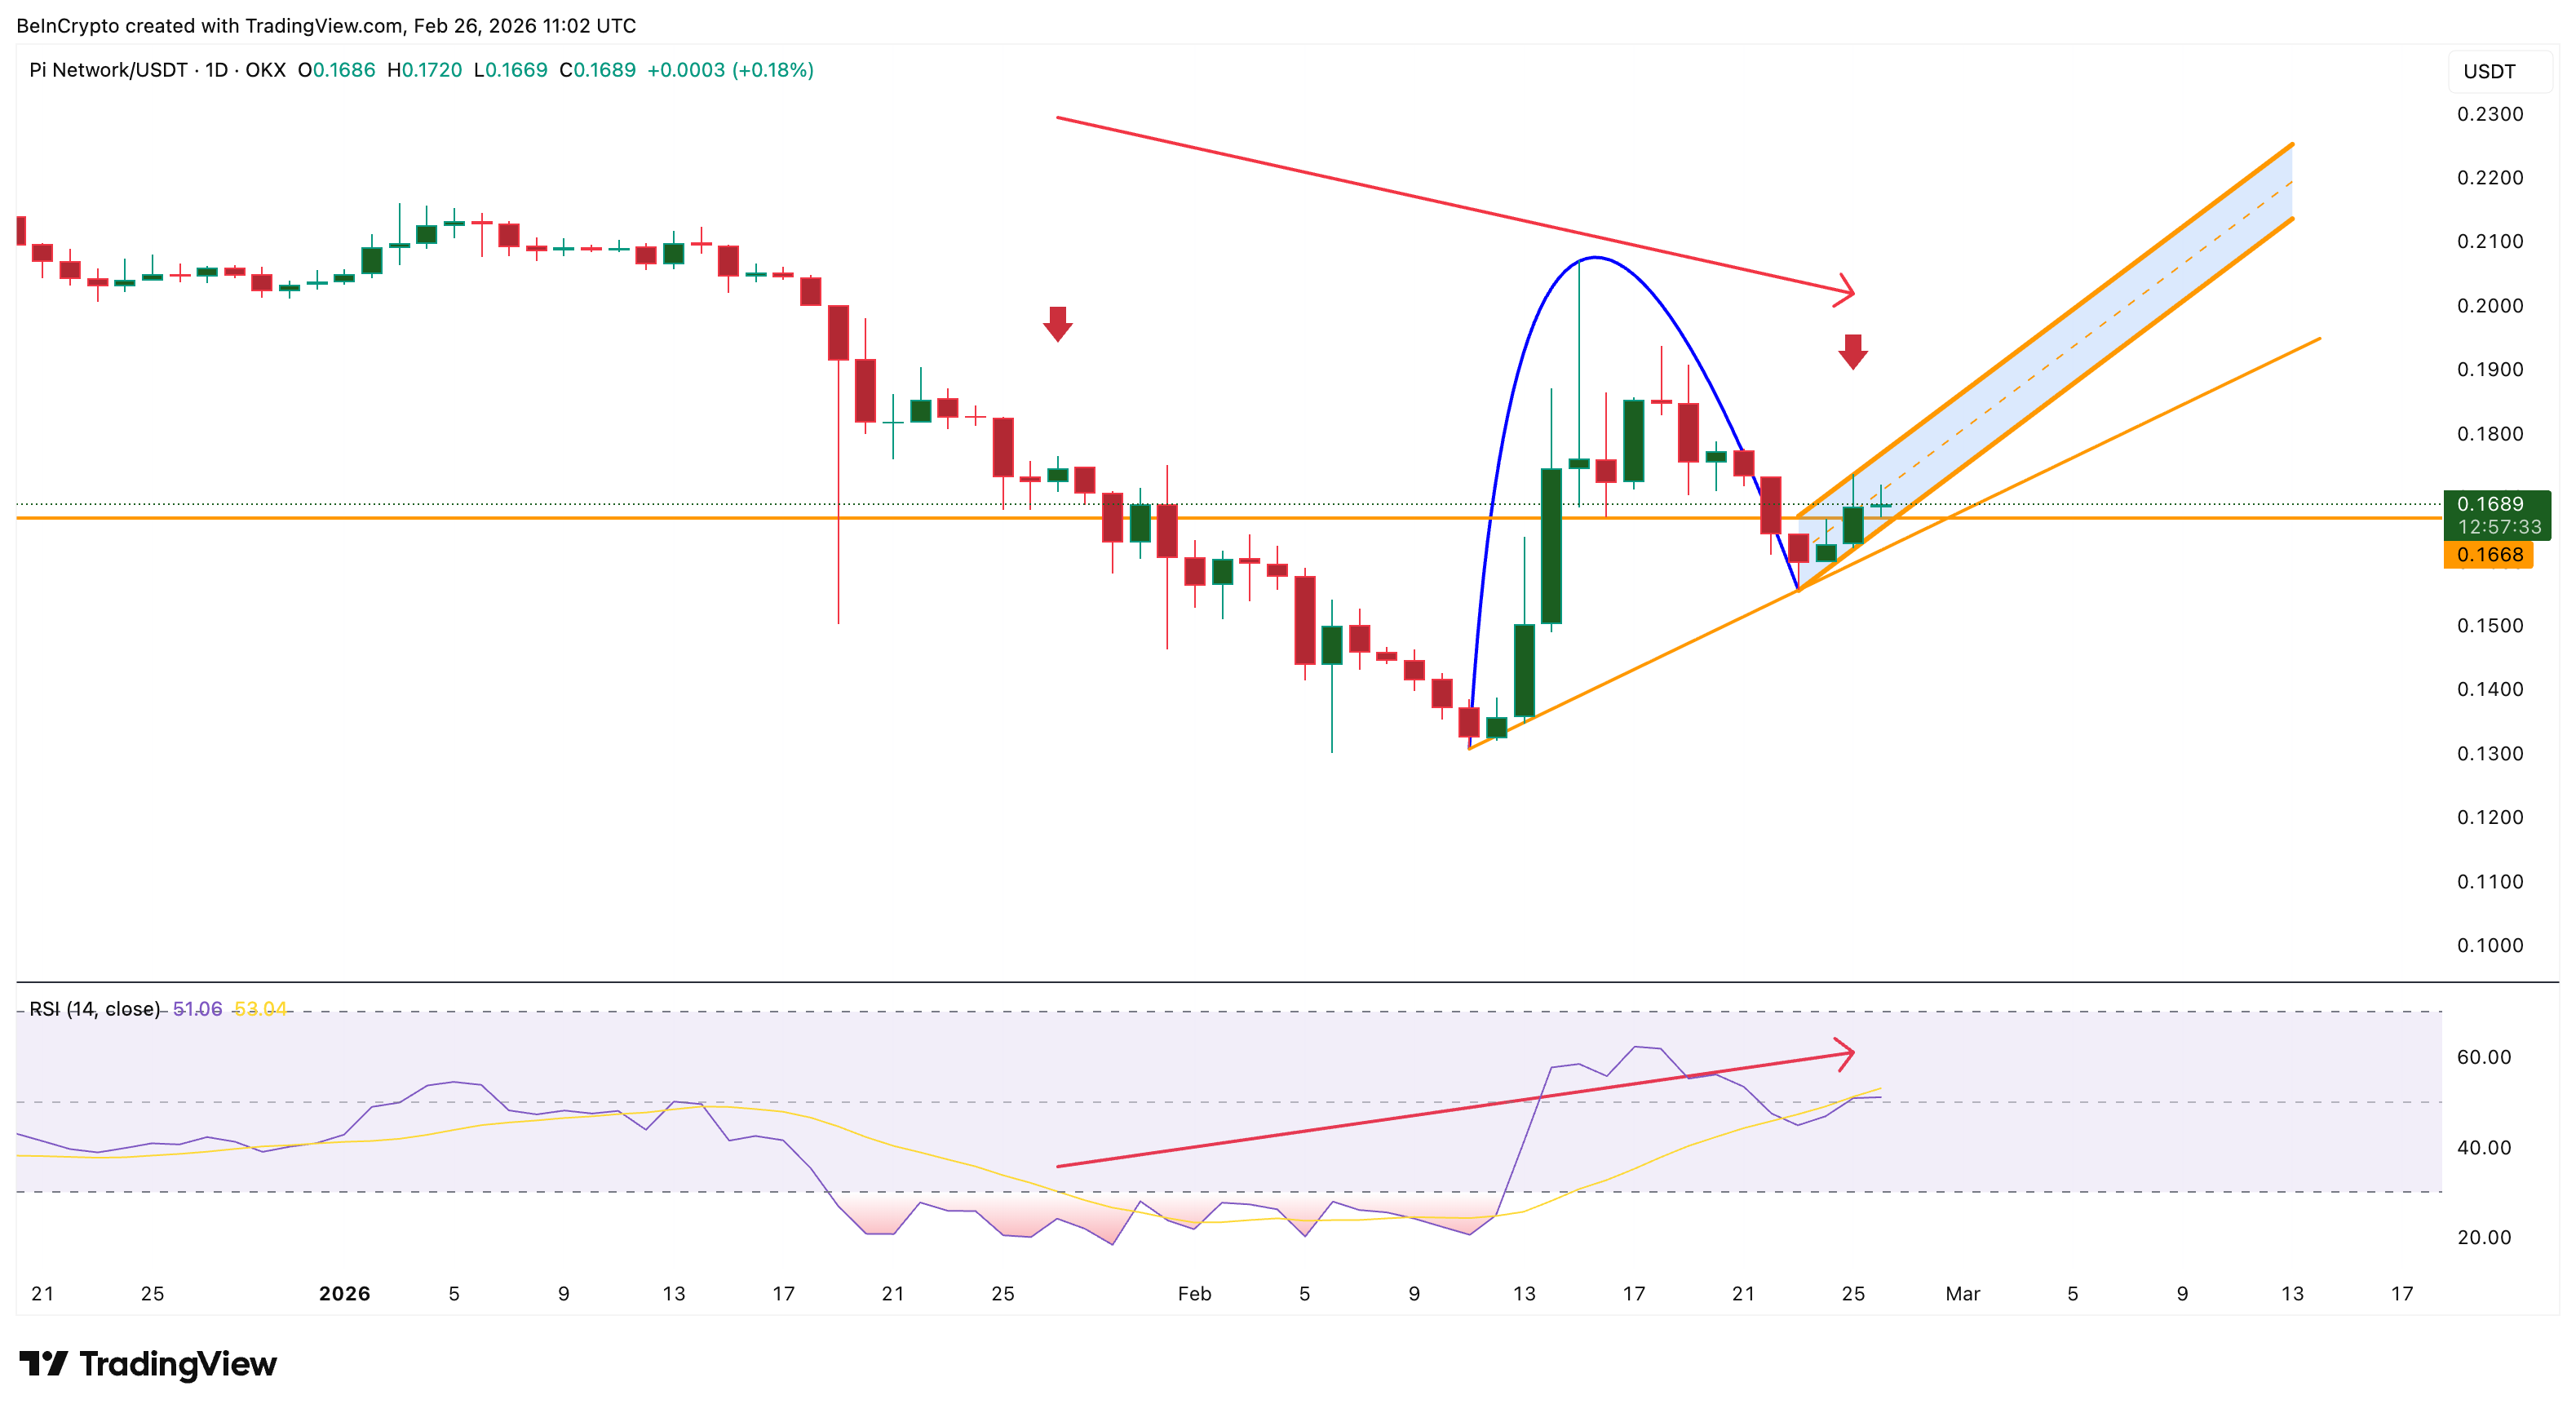
A hidden bearish divergence happens when momentum rises, but the price fails to break resistance. This usually signals that buyers are losing control, and the rebound may soon reverse into a pullback, extending the broader downtrend. When this happens inside a bearish chart pattern, the probability of a breakdown increases
This confirms that even though the Pi Coin price is rising, sellers might still be in control. But if retail is buying, who is selling?
Larger Investors Are Quietly Selling the Pi Network Token
The contradiction becomes even more significant when examining large-scale financial activity. The Chaikin Money Flow (CMF), which tracks whether money is entering or leaving an asset, has been falling steadily and remains below zero. This shows that overall capital is still leaving Pi Coin.
This creates another bearish divergence. The Pi Coin price trended higher between February 11 and February 24, whereas the CMF, the technical proxy for large money, trended lower.
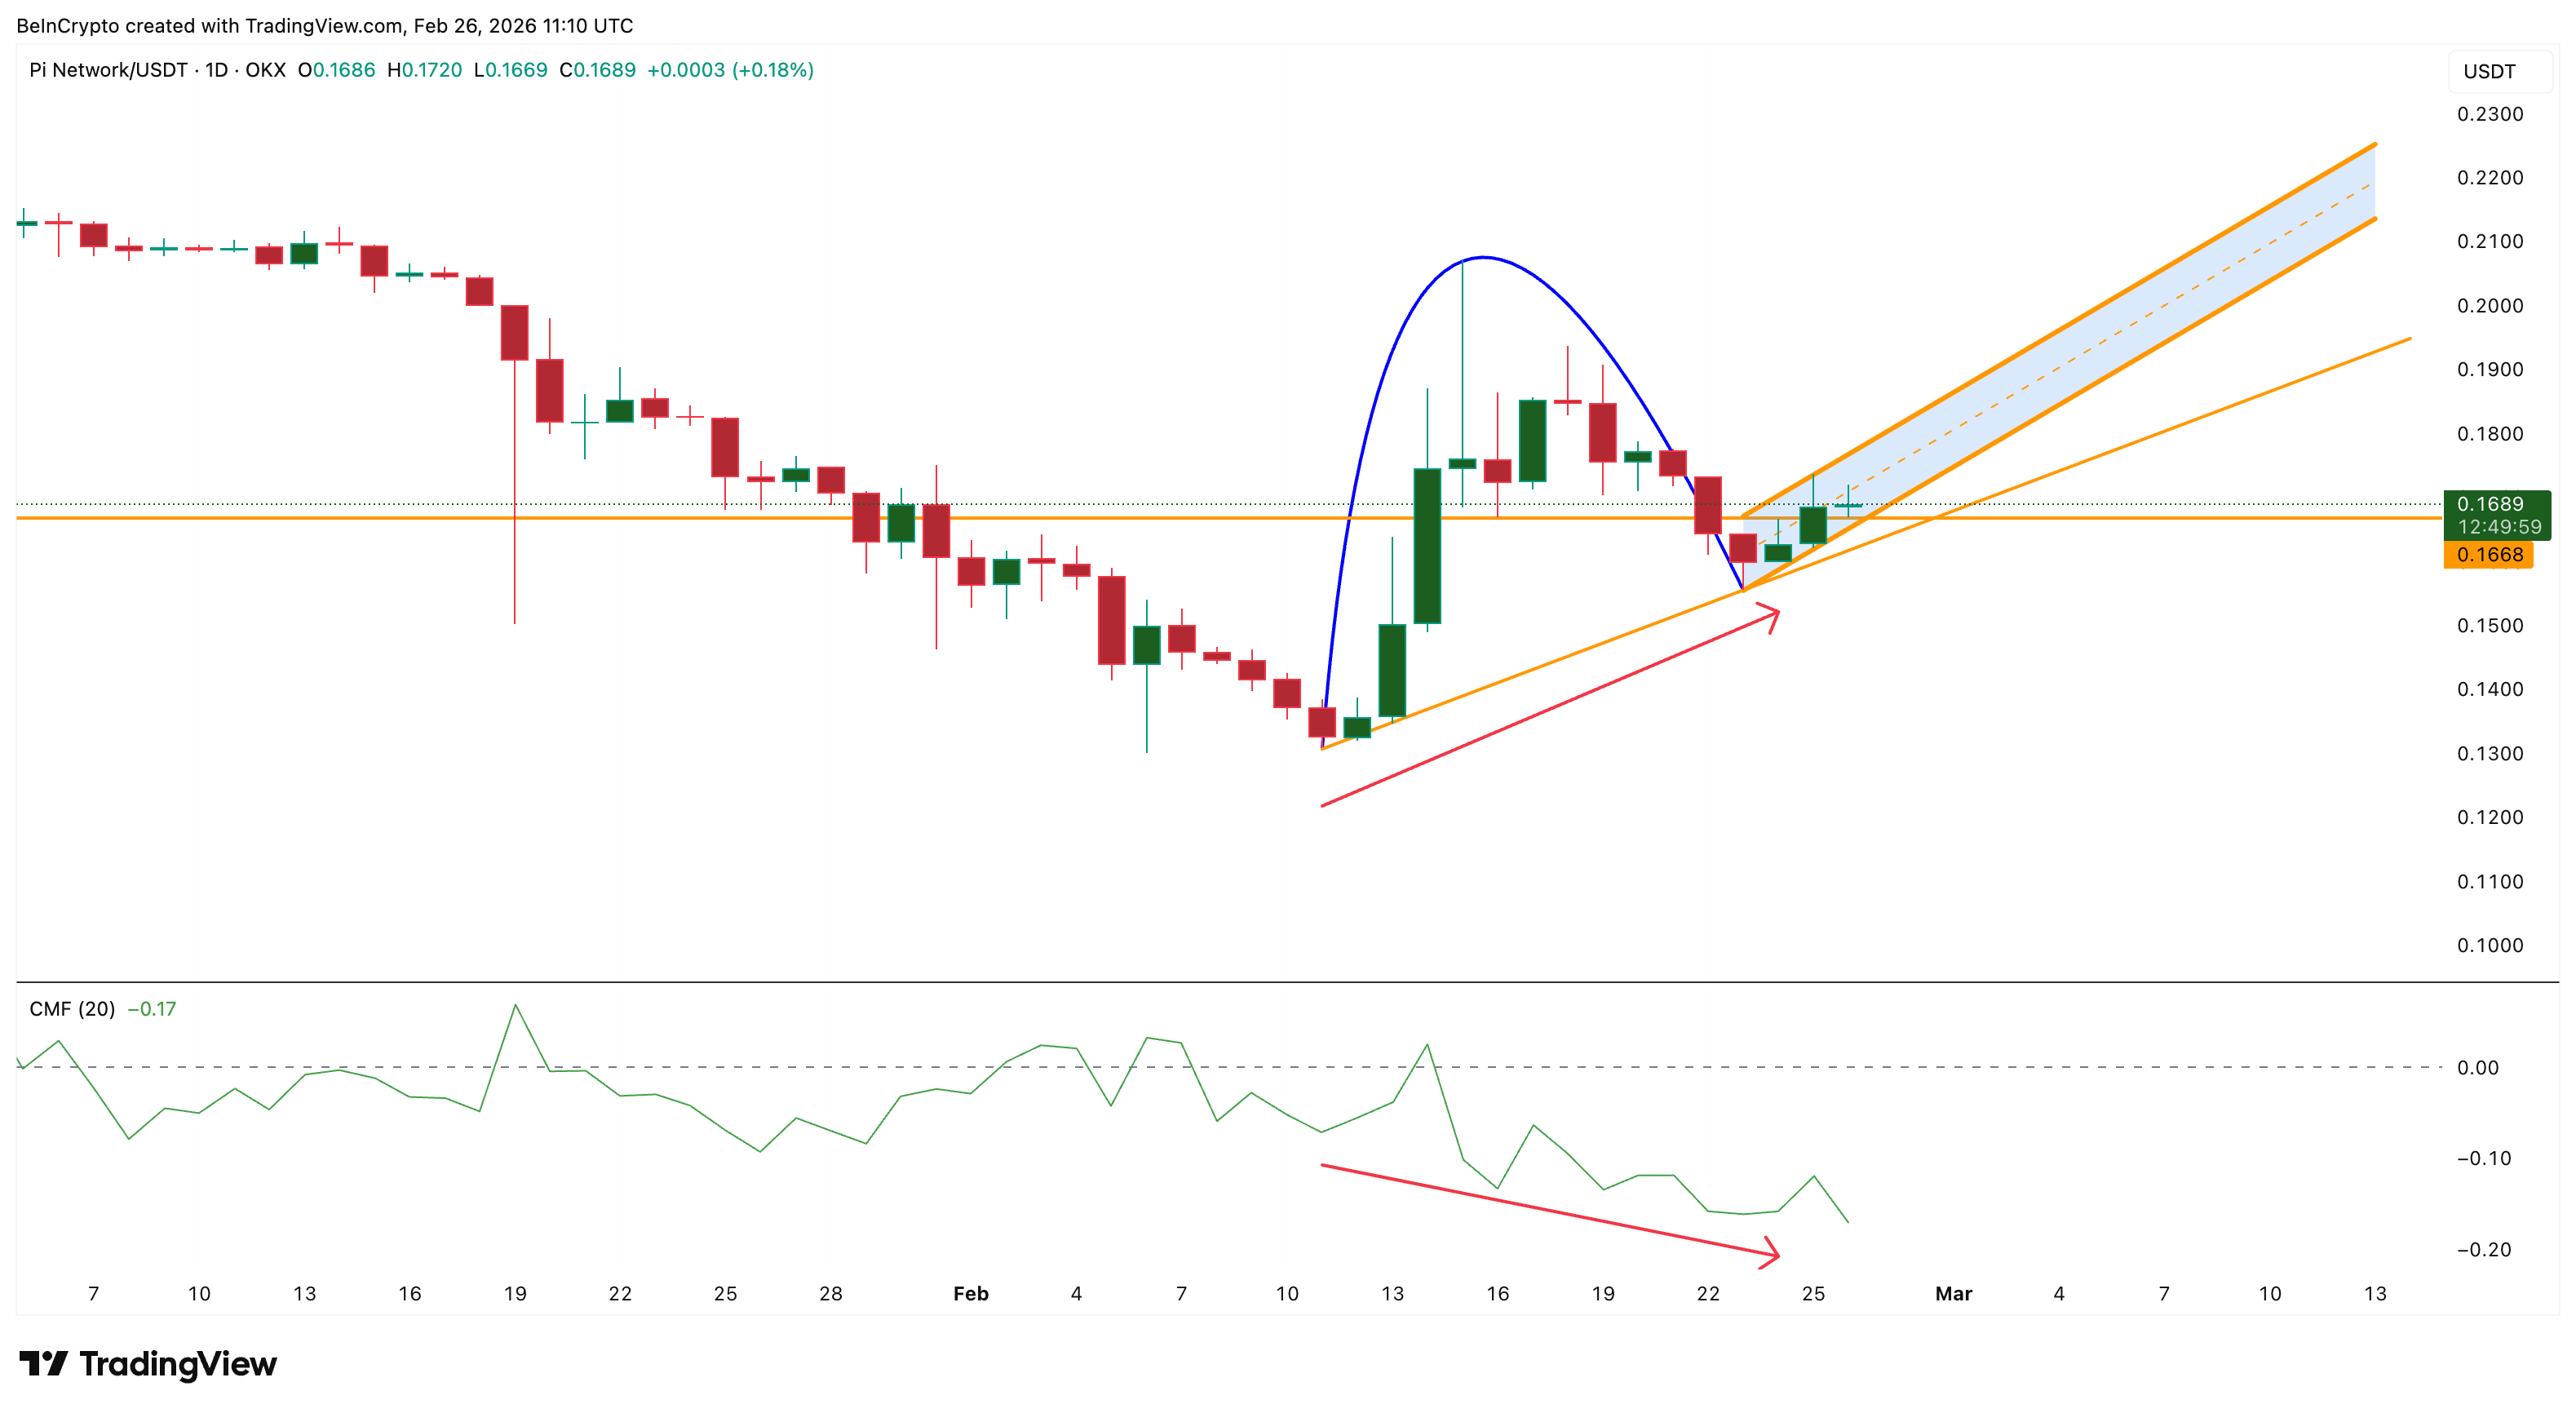
This strongly suggests that larger investors are likely selling into the rebound while retail traders continue buying. This type of behavior often appears before breakdowns. Retail buying helps push prices higher temporarily, but without support from larger investors, the move becomes unsustainable. This explains why Pi Coin’s rebound may be misleading and could even be a trap.
Pi Coin Price Levels Now Decide Whether Recovery Fails or Survives
Pi Coin is now approaching the most critical stage of this structure. If Pi Coin falls below $0.161, the bearish inverted cup and handle breakdown would likely confirm. This could push Pi Coin toward $0.130 (current low) and potentially as low as $0.122, which would mark a new low.
This would confirm that the 11% rebound was only a temporary recovery inside a larger downtrend. However, recovery is still possible if buyers regain control.
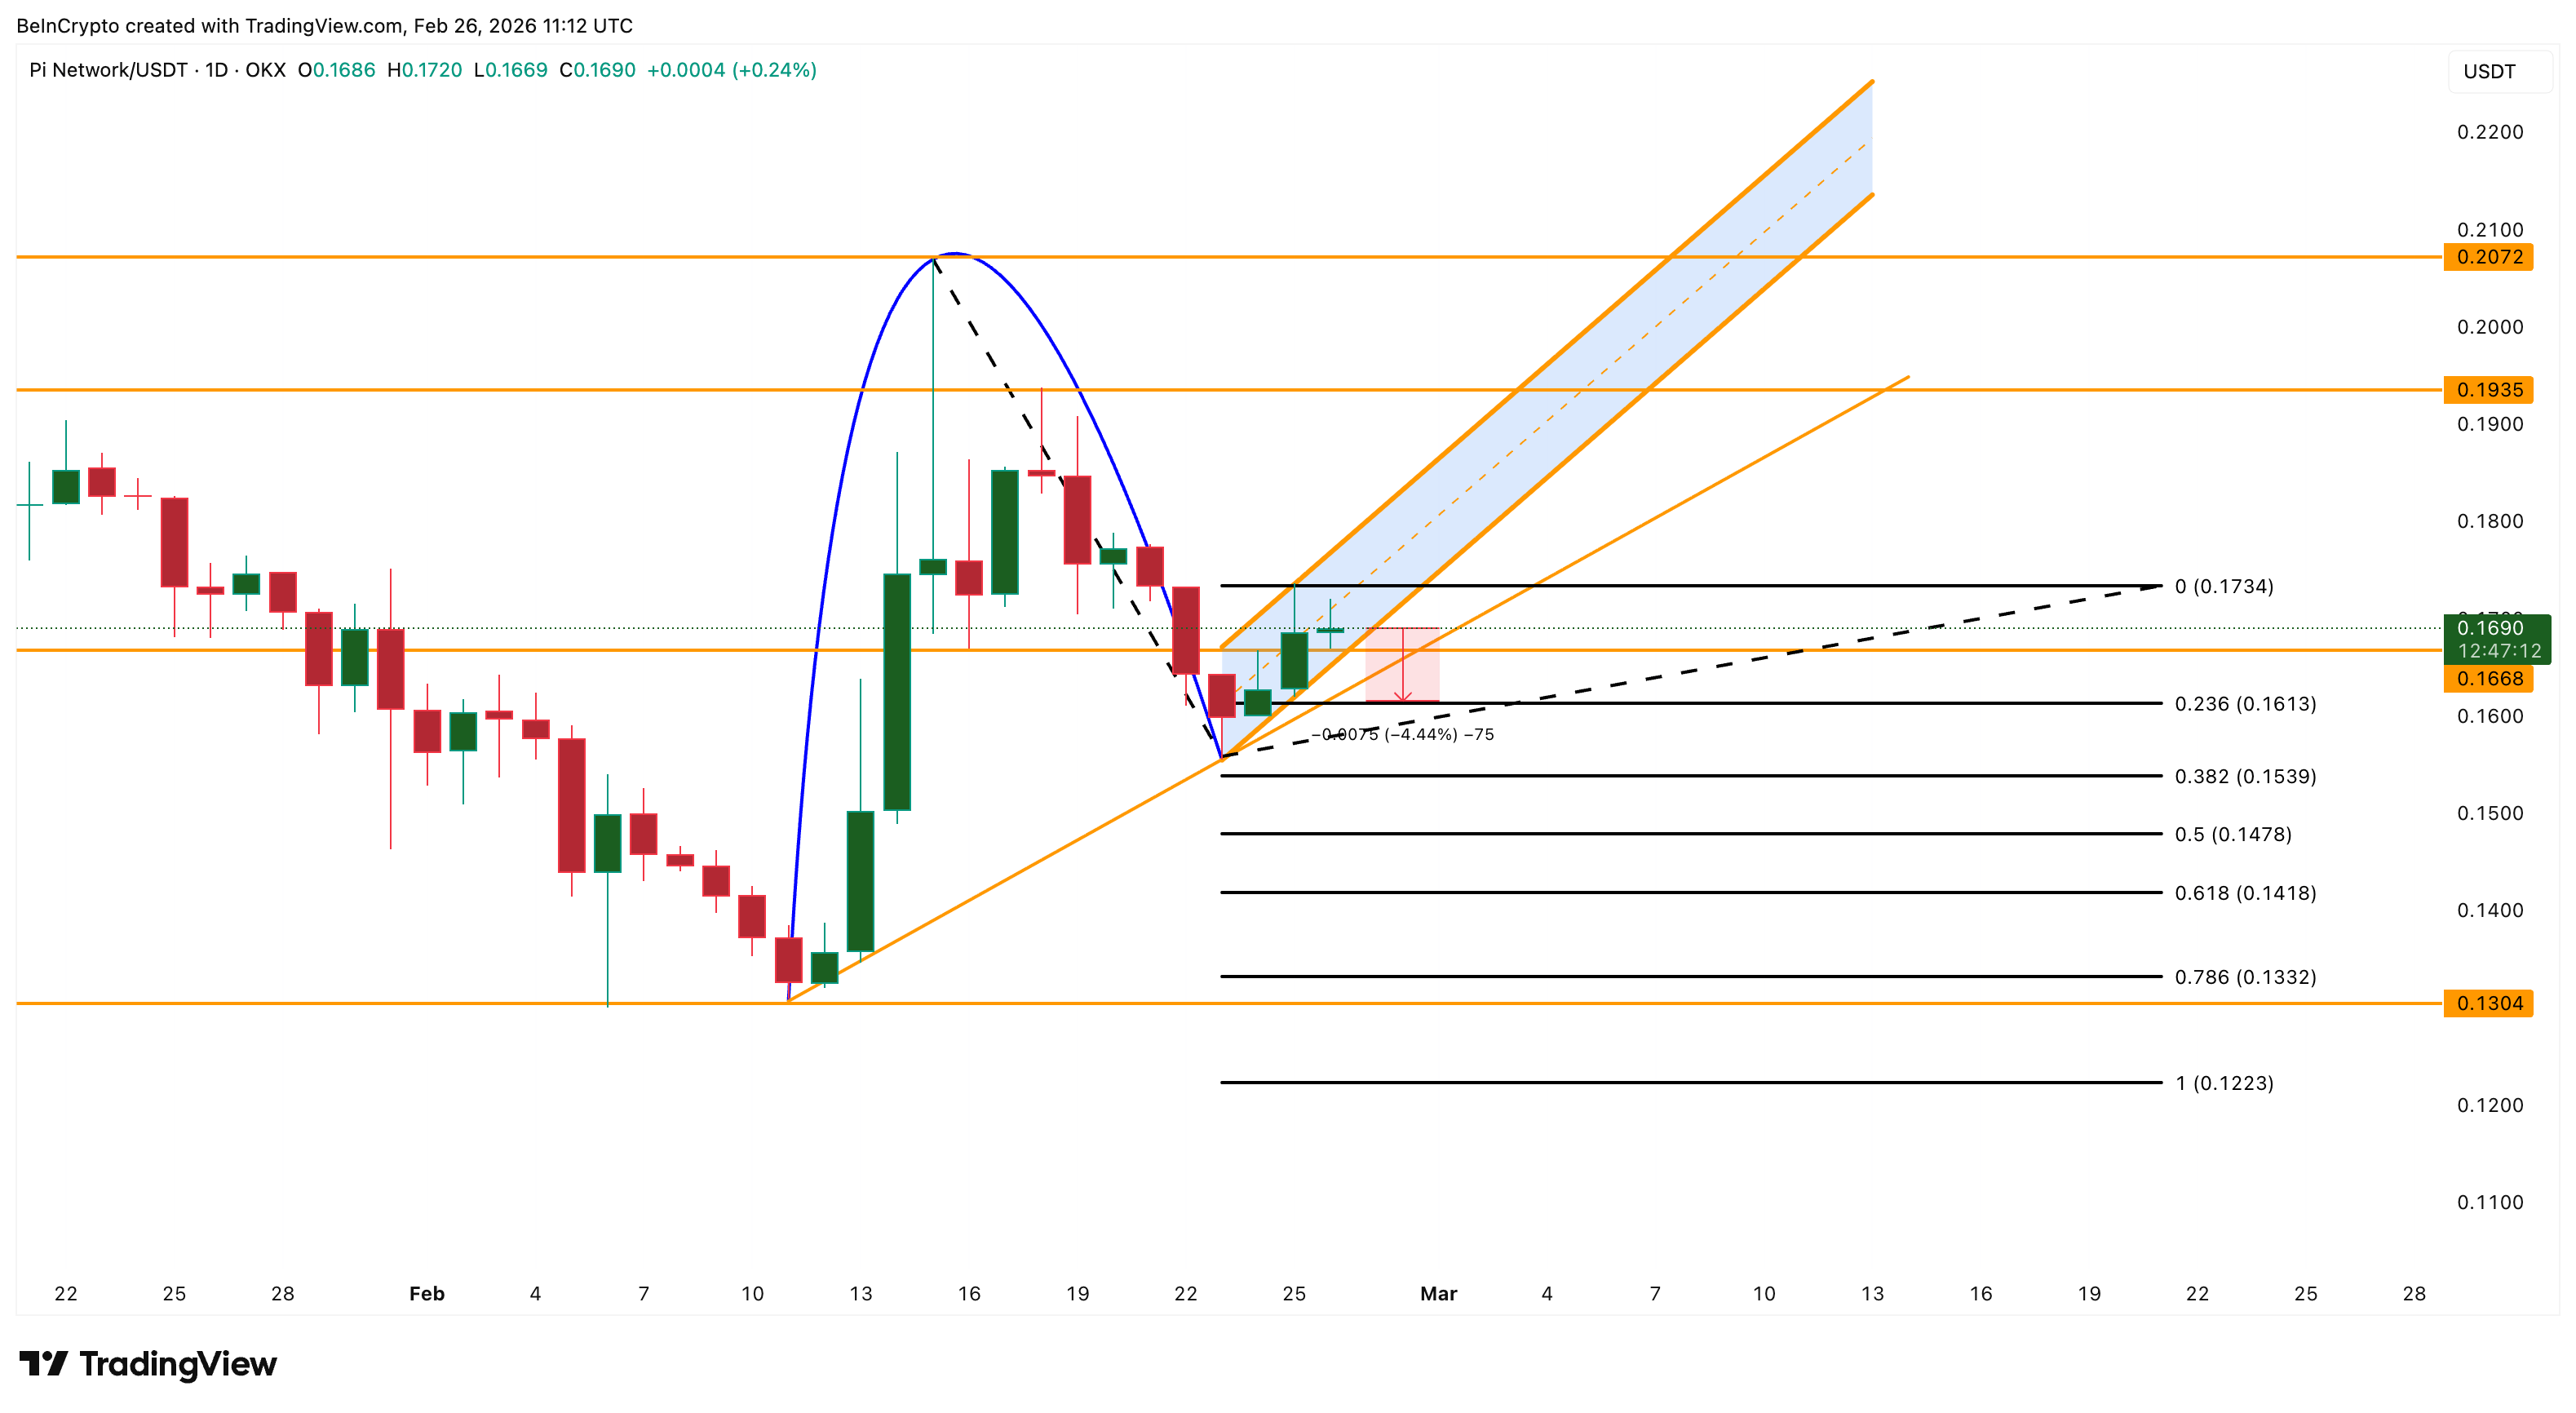
A move above $0.173 would show early strength returning. A break above $0.193 would weaken the bearish pattern significantly. A move above $0.207 would invalidate the bearish structure completely.
Until those resistance levels are reclaimed, the risk remains that Pi Coin’s rebound is not the start of a recovery. Instead, it may be the setup for the next decline.