


Why GPU Utilization Falls Short: Understanding Streaming Multiprocessor (SM) Efficiency for Better LLM Performance


Large Language Models (LLMs) have gained significant prominence in recent years, driving the need for efficient GPU utilization in machine learning tasks. However, researchers face a critical challenge in accurately assessing GPU performance. The commonly used metric, GPU Utilization, accessed through nvidia-smi or integrated observability tools, has proven to be an unreliable indicator of actual computational efficiency. Surprisingly, 100% GPU utilization can be achieved merely by reading and writing to memory without performing any computations. This revelation has sparked a reevaluation of performance metrics and methodologies in the field of machine learning, prompting researchers to seek more accurate ways to measure and optimize GPU performance for LLM training and inference tasks.
Researchers have attempted to address the limitations of GPU Utilization by introducing alternative metrics. One widely known approach is the Model FLOPS (Floating point Operations Per Second) utilization, or MFUs, introduced in Google’s PaLM paper. MFUs measure the ratio of observed throughput to the theoretical maximum throughput of a system operating at peak FLOPs, providing a more accurate representation of GPU performance. This metric offers insights into how efficiently a workload utilizes a GPU’s computational capabilities. However, MFUs have a drawback in their complexity of calculation, as they are parameter and framework-dependent. Despite this limitation, MFUs have revealed significant discrepancies between GPU utilization and actual computational efficiency. For instance, some LLM trainings achieving 100% GPU utilization were found to have only 20% MFUs, far below the typical 35-45% range for most LLM trainings, highlighting the need for a deeper understanding of GPU performance metrics.
Trainy AI researchers (a company specializing in GPU cluster management infrastructure) tackled the challenge of optimizing LLM training efficiency for a foundation model company. Their approach involved implementing a series of performance-tuning techniques commonly recommended for PyTorch. These optimizations included saturating the GPU by adjusting dataloader parameters, maximizing tensor core usage through mixed precision training, employing fused optimizers from apex or deepspeed, and utilizing instances and networking specifically designed for training tasks. By applying these methods, Trainy successfully achieved 100% GPU utilization and significant power draw, initially indicating improved performance. However, to gain a more comprehensive understanding of the actual computational efficiency, the team went a step further by calculating the Model FLOPS utilization (MFUs) of the training workload, recognizing the limitations of relying solely on GPU utilization as a performance metric.
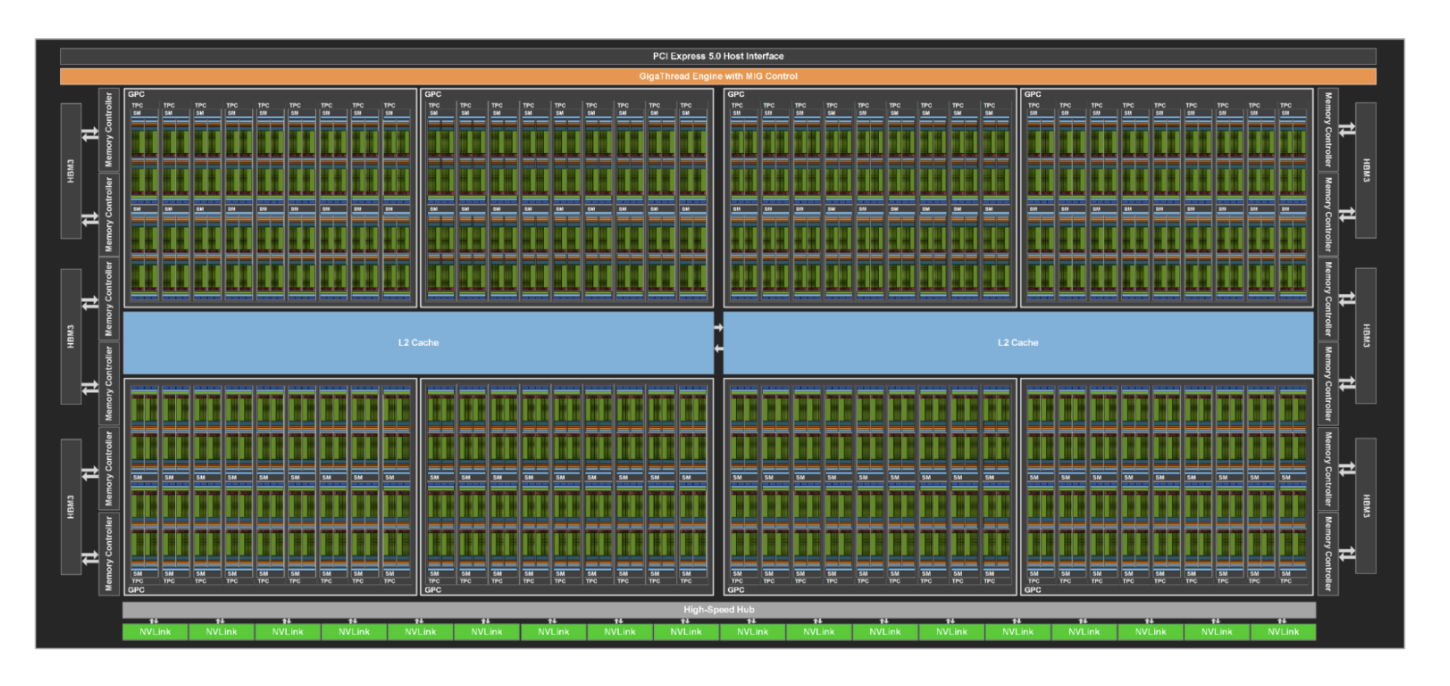
GPU architecture is key to understanding the limitations of GPU utilization as a performance metric. GPUs consist of cores and multiprocessing managers (SMs in NVIDIA, CUs in AMD). The GH100 GPU, for example, has 144 SMs, each managing multiple CUDA cores. NVIDIA’s definition of GPU utilization is vague, while Datadog’s NVML documentation provides more clarity. However, this metric can be misleading as it only indicates GPU activity, not computational efficiency. When a CUDA kernel is launched, work is distributed across cores by SMs, but the utilization percentage doesn’t reflect the intensity or effectiveness of these computations.
To further investigate performance bottlenecks, researchers turned to profiling the model’s training loop using PyTorch Profiler. This analysis revealed a critical insight: the Softmax kernel was registering high GPU utilization but low SM (Streaming Multiprocessor) efficiency. This discrepancy raised concerns, as naive Softmax implementation is a well-known bottleneck for Large Language Models. The low SM efficiency indicated potential inefficiencies in the model’s execution, despite high GPU utilization. This observation aligns with the limitations of relying solely on GPU utilization as a performance metric. To address such memory-bound operations, various kernel fusion techniques like FlashAttention have been developed. The profiling results emphasized the need for a more nuanced approach to optimizing LLM training, focusing on improving SM efficiency alongside GPU utilization.
SM efficiency, also known as SM activity, is a crucial metric for NVIDIA GPUs that measures the percentage of active SMs in a given time interval. For instance, an NVIDIA H100 GPU contains 132 SMs, each managing 128 cores, totaling 16,896 cores. This metric provides insights into how effectively CUDA kernels utilize available SMs. A CUDA kernel running continuously for 10 seconds but using only 1 SM on an H100 would show 100% GPU utilization, but merely 0.7% SM efficiency. This discrepancy highlights the importance of looking beyond GPU utilization. By monitoring SM efficiency layer by layer, researchers can identify potential optimization opportunities and low-hanging fruits in LLM training, enabling more targeted performance improvements and a more accurate assessment of computational efficiency.
To optimize LLM training, researchers focused on fusing layers within the transformer block. This approach involves replacing PyTorch native layer definitions with GPU kernels implemented in CUDA or Triton, combining multiple layers into a single kernel. The optimization targets included Softmax (using Flash Attention), MLP, and dropout layer norm residual add operations. These fused kernels, often available in libraries like Flash Attention, offer improved performance and reduced memory usage.
Implementation challenges primarily involved identifying appropriate layers for replacement, as torch.compile’s automatic optimizations were incompatible with newer distributed strategies like FSDP. Manual implementation of fused kernels was necessary due to these limitations.
The optimization efforts yielded significant improvements: a 4x speedup in training time and an increase in Model FLOPS Utilization (MFU) from 20% to 38%. These gains resulted from the implementation of fused kernels and fine-tuning model parallelism to leverage the available 3.2 Tbps Infiniband infrastructure effectively.
In this study, researchers recommend tracking SM Efficiency and GPU Utilization on GPU clusters to measure performance accurately. While GPU Utilization indicates if the machine is idle, SM Efficiency shows how effectively the GPU is used. Calculating MFUs is beneficial but complex for continuous monitoring. Nvidia’s Data Center GPU Manager (DCGM) tracks SM activity by default. Other metrics like SM occupancy provide detailed insights into each SM’s workload but are more complex to interpret. For deeper understanding, refer to the Pytorch Profiler blog, DCGM documentation, and Nsight’s profiling guides.
Check out the Paper. All credit for this research goes to the researchers of this project. Also, don’t forget to follow us on Twitter and join our Telegram Channel and LinkedIn Group. If you like our work, you will love our newsletter..
Don’t Forget to join our 50k+ ML SubReddit
Here is a highly recommended webinar from our sponsor: ‘Building Performant AI Applications with NVIDIA NIMs and Haystack’
Asjad is an intern consultant at Marktechpost. He is persuing B.Tech in mechanical engineering at the Indian Institute of Technology, Kharagpur. Asjad is a Machine learning and deep learning enthusiast who is always researching the applications of machine learning in healthcare.