


Shiba Inu (SHIB) Price Analysis: Will Breakout Occur?

The Shiba Inu (SHIB) price is trading in the middle of a long-term range between $0.0000060 – $0.0000080.
In lower timeframes, the SHIB price is trading inside a corrective pattern.
Descent Causes Breakdown Below Support
The weekly timeframe technical analysis for the SHIB price gives a bearish outlook because of the price action.
A descending resistance trendline rejected the SHIB price in July (red icon). This created a long upper wick and catalyzed the ongoing downward movement. During the descent, SHIB also broke down below the $0.0000080 horizontal area, which had been providing support.
After such breakdowns, horizontal support areas often turn to resistance. Another touch of the area and subsequent decrease will confirm the $0.0000080 area as resistance. The horizontal area is very close to the descending resistance trendline.
The weekly RSI is also bearish. With the RSI as a momentum indicator, traders can determine whether a market is overbought or oversold and decide whether to accumulate or sell an asset.
Bulls have an advantage if the RSI reading is above 50 and the trend is upward, but if the reading is below 50, the opposite is true.
At the same time, the trendline rejected the price; the RSI was rejected at 50 (red circle) and is now falling. These are both considered signs of a bearish trend.
SHIB Price Prediction: Will Breakout Occur?
The analysis from the 12-hour timeframe offers a more bullish outlook.
The main reason for this is that the price is trading in the upper portion of a descending parallel channel. These channels usually contain corrective movements, meaning that an eventual breakout from it is the most likely future price outlook.
The fact that the meme coin trades in its upper portion further aligns with this possibility.
Additionally, the RSI is increasing and nearly moved above 50 (green circle), both signs of a bullish trend.
If the cryptocurrency breaks out, it can increase by 30% and reach the long-term descending resistance trendline at $0.0000095.
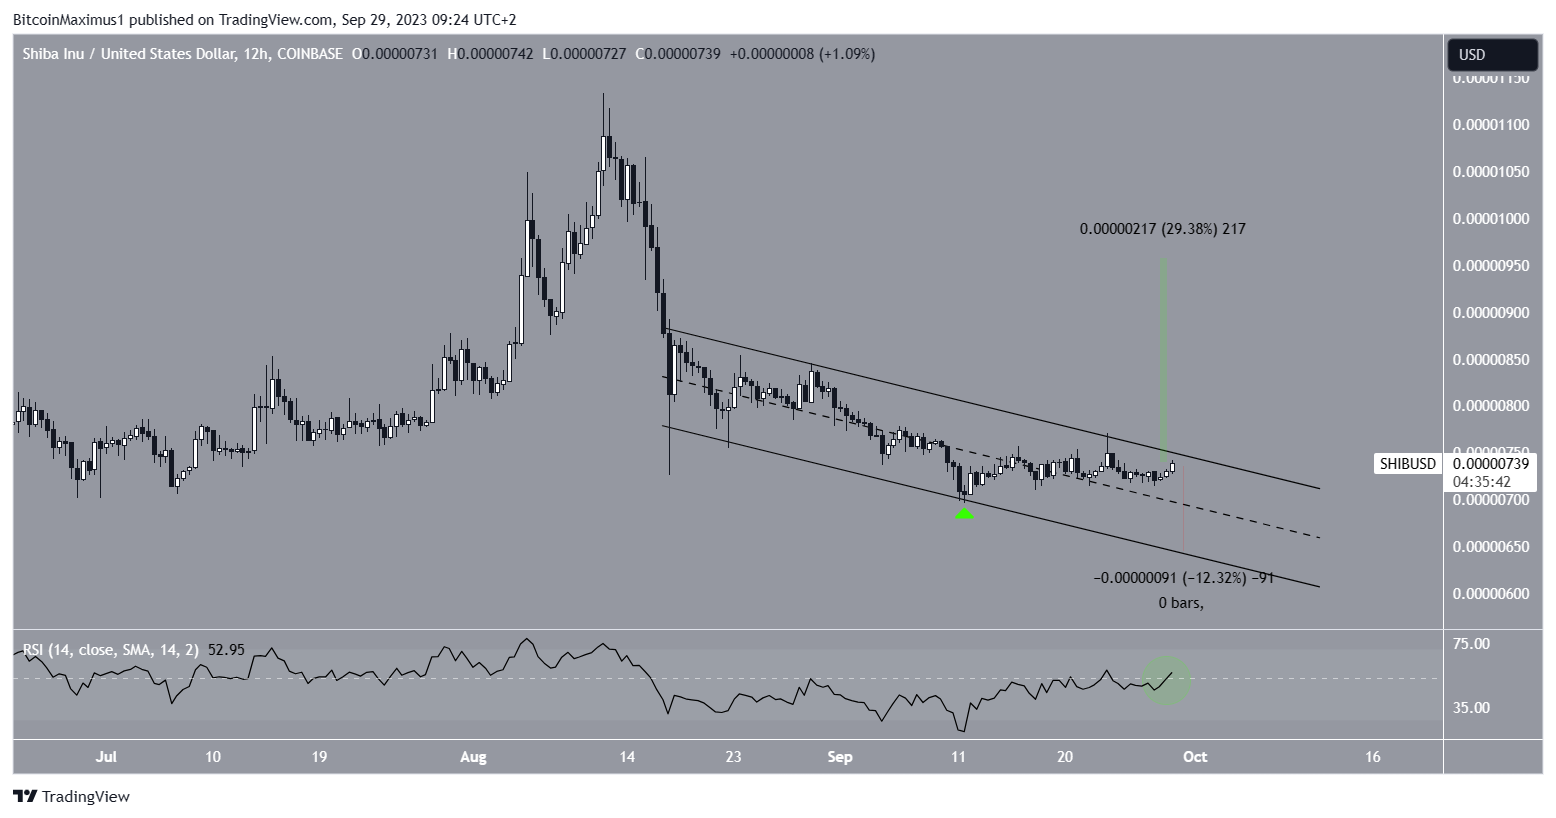
However, this bullish SHIB price analysis will be invalidated if the channel’s resistance trendline rejects the price.
In that case, a 12% drop to the support trendline at $0.0000065 will likely be the future outlook.
For BeInCrypto’s latest crypto market analysis, click here
Disclaimer
In line with the Trust Project guidelines, this price analysis article is for informational purposes only and should not be considered financial or investment advice. BeInCrypto is committed to accurate, unbiased reporting, but market conditions are subject to change without notice. Always conduct your own research and consult with a professional before making any financial decisions.